化学の数値はすべて測った値であり、測った値には必ず誤差がある。だから「どの器具で測ったか」「何桁まで信用できるか」を数値と一緒に扱わなければならない。この章では、正確さと精密さの区別、体積をはかる器具の使い分け、有効数字の規則、単位の換算、そしてグラフと検量線の作り方をまとめる。
地味に見えるが、臨床検査の数値を読むことも、薬の量を計算することも、単位をそろえて桁を正しく扱うことに尽きる。mg と µg の取り違えは1000倍の誤投与になる。
- 正確さと精密さ — 系統誤差と偶然誤差
- 体積をはかる器具 — 精度の順と目盛りの読み方
- 有効数字 — 何桁まで信用できるか
- 物理量と単位の換算 — 接頭語・温度・検査値の単位
- グラフと検量線 — 軸の決め方と値の読み取り
正確さと精密さ — 系統誤差と偶然誤差
正確さ(accuracy)は測定値が真の値(基準値)にどれだけ近いか、精密さ(precision)は同じ条件で繰り返し測った値どうしがどれだけそろっているかである。精密さはばらつきだけの話で、真の値とは関係しない。的当てにたとえると、矢が中心の近くに集まれば正確で精密、中心から外れた一点に固まれば精密だが不正確である。
測定値と真の値の差を誤差、真の値がありそうな幅を不確かさと呼び、44.0 ± 0.4 のように書く。不確かさが大きいほど信頼性は低い。
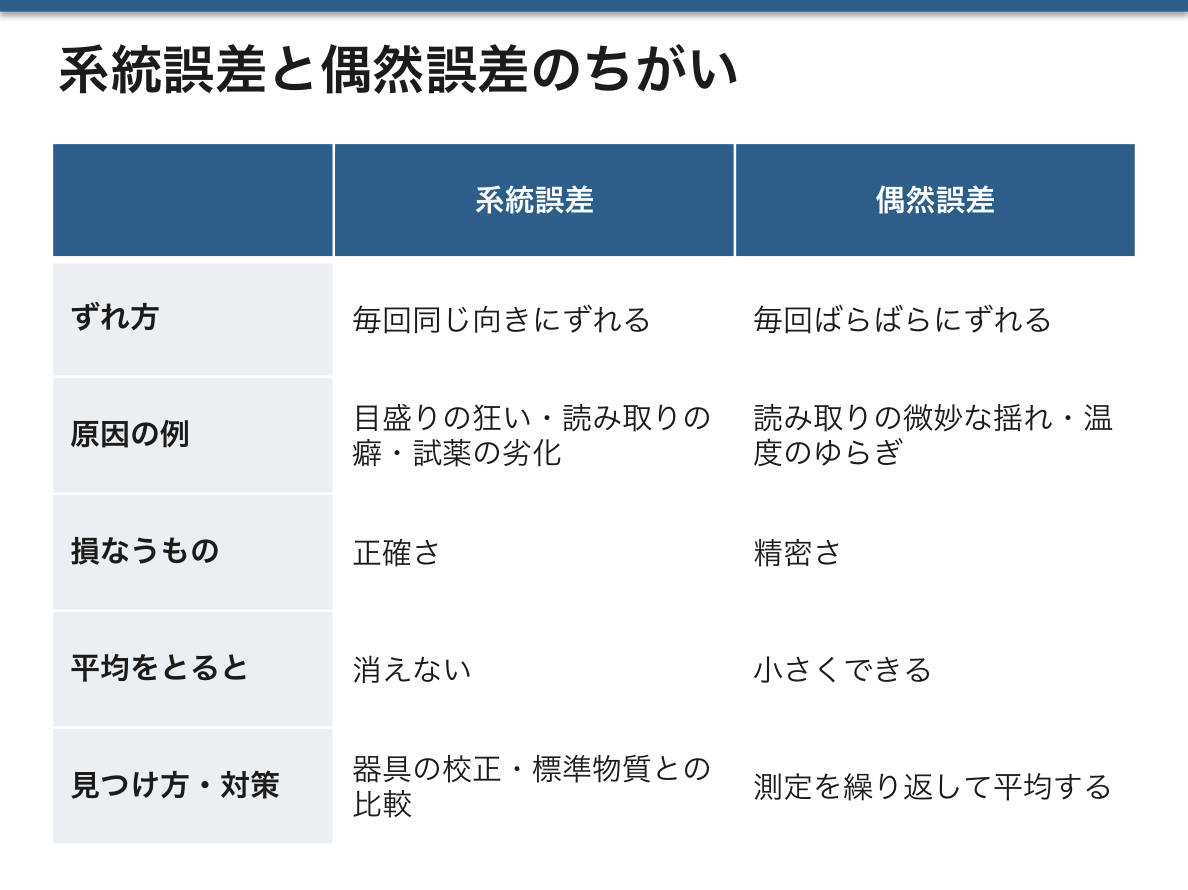
誤差は2種類に分けると対策が見える。系統誤差は毎回同じ向きにずれる誤差で、器具の目盛りの狂い、読み取りの癖(メニスカスを上から見る)、試薬の劣化などが原因になる。平均をとっても消えず、正確さを損なう。器具の校正や標準物質との比較で見つける。偶然誤差は毎回ばらばらにずれる誤差で、読み取りの微妙な揺れや温度のゆらぎが原因になる。精密さを損なうが、測定を繰り返して平均をとると小さくできる。滴定を3回行って平均するのはこのためで、1回だけ大きく外れた値は操作ミスを疑って除く。
臨床検査の精度管理は、まさにこの2つを分けて監視している。同じ管理試料を毎日測り、ばらつきの大きさ(精密さ)と基準値からの片寄り(正確さ・真度)を別々に記録する。測定値が少しずつ一方向にずれていくなら試薬や装置の系統誤差を疑う。検査値を「前回より少し高い」と読むとき、その差が測定のばらつきの範囲内かどうかを考える習慣は、ここから来ている。
English version
Core
Accuracy is how close a result is to the true (accepted) value. Precision is how close repeated results under the same conditions are to each other. Precision is only about spread; it says nothing about the true value. Think of a dartboard: darts grouped near the centre are accurate and precise; darts grouped tightly far from the centre are precise but not accurate.
The difference between a result and the true value is the error. The range where the true value probably lies is the uncertainty, written as 44.0 ± 0.4. A larger uncertainty means a less reliable result.
Going further
Splitting errors into two types shows what to do. A systematic error moves every result in the same direction: a badly marked scale, a reading habit (looking at the meniscus from above), an old reagent. Averaging does not remove it, and it reduces accuracy. We find it by calibrating equipment or comparing with a standard. A random error moves results in different directions each time: small changes in reading or temperature. It reduces precision, but repeating the measurement and averaging makes it smaller. This is why we titrate three times and use the mean, and why we drop a single result that is far off as a probable handling mistake.
In the clinic
Quality control in a clinical laboratory watches these two things separately. The same control sample is measured every day, and the spread (precision) and the shift from the target (accuracy, trueness) are recorded separately. If results slowly drift in one direction, a systematic error in the reagent or the analyser is suspected. When you read a lab value as “a little higher than last time”, ask whether the difference is inside the normal spread of the measurement.
体積をはかる器具 — 精度の順と目盛りの読み方
器具は「正確な体積をはかるもの」と「おおよその体積でよいもの」に分かれる。
| 器具 | 用途 | 精度 |
|---|---|---|
| メスフラスコ(volumetric flask) | 決まった体積の溶液を正確に作る | 高い(標線1本) |
| ホールピペット(volumetric pipette) | 決まった体積を正確に取り出す | 高い(標線1本) |
| ビュレット(burette) | 滴定で、加えた体積を正確に読む | 高い(0.1 mL 目盛り、0.01 mL まで読む) |
| メスピペット(measuring pipette) | 任意の少量を取り出す | 中くらい |
| メスシリンダー(measuring cylinder) | おおよその体積をはかる | 低め |
| ビーカー・三角フラスコ・試験管・プラスチックピペット | 混ぜる・反応させる・移す | 体積をはかる器具ではない |
ピペットには必ず安全ピペッターを使い、口で吸わない。
なぜ首の細い器具ほど精密なのか。液面の高さを合わせるときの読み取りの狂いは、どの器具でもだいたい同じ(0.5 mm 程度)である。首が細ければ、その高さのずれに相当する体積はごく小さい。メスフラスコやホールピペットが標線のところだけ細く絞ってあるのはこのためで、ビーカーのように口が広いと同じ高さのずれが大きな体積の差になる。
水溶液の液面はへこんだ曲面(メニスカス)になるので、メニスカスの底を目の高さで読む。上や下から見ると系統誤差が入る。目盛りは最小目盛りの1/10まで目分量で読むのが原則で、0.1 mL 目盛りのビュレットなら 12.35 mL のように小数第2位まで記録する。ビュレットの目盛りは上が0で下に向かって増えるので、読みの差がそのまま流し出した体積になる。
English version
Core
Glassware is either for measuring an exact volume or for when an approximate volume is enough.
| Glassware | Use | Precision |
|---|---|---|
| Volumetric flask | Make a fixed volume of solution exactly | High (one mark) |
| Volumetric pipette | Take out a fixed volume exactly | High (one mark) |
| Burette | Read the added volume exactly in a titration | High (0.1 mL marks, read to 0.01 mL) |
| Measuring (graduated) pipette | Take out any small volume | Medium |
| Measuring cylinder | Measure an approximate volume | Lower |
| Beaker, conical (Erlenmeyer) flask, test tube, plastic pipette | Mix, react, transfer | Not for measuring volume |
Always use a pipette filler (safety bulb). Never pipette by mouth.
Going further
Why is glassware with a narrow neck more precise? The error in setting the liquid level is about the same for any vessel (about 0.5 mm). In a narrow neck, that height error is only a tiny volume. This is why volumetric flasks and pipettes are narrow at the mark. In a wide beaker the same height error is a large volume.
The surface of a water solution is a curved dip (the meniscus). Read the bottom of the meniscus at eye level; looking from above or below adds a systematic error. As a rule, estimate one tenth of the smallest division. With 0.1 mL marks on a burette, record two decimals, such as 12.35 mL. A burette reads 0 at the top and increases downwards, so the difference between two readings is the volume delivered.
有効数字 — 何桁まで信用できるか
有効数字とは、確かな桁すべてと、最初の不確かな1桁を合わせたものである。数え方の規則は3つ。
①0でない数字はすべて有効。26.38 は4桁。
②有効数字にはさまれた0は有効。0.0101 は3桁、7.09 × 10⁻⁵ は3桁。
③小数点より右の末尾の0は有効。0.00500 は3桁、0.03040 は4桁。
先頭の0(0.001 の 0.00)は位取りにすぎないので有効ではない。100 のように整数の末尾に0が並ぶと桁数があいまいになるので、1.00 × 10²(3桁)のように指数表記で書いて意図を示す。
計算結果の桁は、いちばん不確かな測定値に合わせる。答えが材料より確かになることはありえないからである。
| 演算 | 規則 | 例 |
|---|---|---|
| 足し算・引き算 | 小数点以下の桁数がいちばん少ないものに合わせる | 12.439 + 9.375 + 15.7 = 37.514 → 37.5 |
| 掛け算・割り算 | 有効数字の桁数がいちばん少ないものに合わせる | 36.0 × 0.42 = 15.12 → 15 |
途中の計算では桁を落とさず、最後に一度だけ丸める。途中で何度も丸めると誤差が積み重なる。なお、数えた数(試験管3本)や定義で決まった数(1 L = 1000 mL、係数の2)は誤差をもたないので、桁数の判断に使わない。
検査値の報告桁にも同じ考え方がある。血清 K が 4.2 mmol/L と小数1桁で返ってくるのは、それ以上の桁は測定のばらつきに埋もれて意味をもたないからである。電卓で出た 4.2378 をそのまま書き写すと、実際以上の確かさがあるかのように見せてしまう。
English version
Core
Significant figures are all the certain digits plus the first uncertain digit. There are three rules.
① All non-zero digits are significant. 26.38 has 4.
② Zeros between significant digits are significant. 0.0101 has 3; 7.09 × 10⁻⁵ has 3.
③ Trailing zeros to the right of the decimal point are significant. 0.00500 has 3; 0.03040 has 4.
Leading zeros (the 0.00 in 0.001) only show the position, so they are not significant. Trailing zeros in a whole number such as 100 are unclear, so use scientific notation to show what you mean: 1.00 × 10² has 3.
Going further
A result must match the least certain measurement, because an answer cannot be more certain than its data.
| Operation | Rule | Example |
|---|---|---|
| Addition, subtraction | Keep the smallest number of decimal places | 12.439 + 9.375 + 15.7 = 37.514 → 37.5 |
| Multiplication, division | Keep the smallest number of significant figures | 36.0 × 0.42 = 15.12 → 15 |
Keep all digits during the calculation and round only once, at the end. Rounding many times adds error. Counted numbers (three test tubes) and defined numbers (1 L = 1000 mL, a coefficient of 2) have no error, so they do not limit the digits.
In the clinic
Lab reports follow the same idea. Serum K comes back as 4.2 mmol/L, with one decimal, because further digits are lost in the measurement spread. Copying 4.2378 from a calculator makes the value look more certain than it is.
物理量と単位の換算 — 接頭語・温度・検査値の単位
医化学で使う主な量と単位をそろえておく。
| 量 | 記号 | 単位 |
|---|---|---|
| 物質量 | n | mol |
| 質量 | m | g、kg、mg |
| 体積 | V | L(= dm3)、mL(= cm3) |
| 密度 | ρ | g/mL |
| モル質量 | M | g/mol |
| 質量分率 | w(w%) | 単位なし(0〜1)、または % |
| モル濃度 | cM | mol/L(= M) |
| 質量濃度 | γ | mg/mL、g/L |
| 温度・絶対温度 | t・T | °C・K(T = t + 273.15) |
接頭語は k(103)、d(10−1)、c(10−2)、m(10−3)、µ(10−6)、n(10−9)を確実にする。
換算は「1になる分数」を掛けると迷わない。400 mg を g にするなら 400 mg × (1 g / 1000 mg) = 0.400 g。単位も数字と同じように約分され、残った単位が求めたい単位になっていれば式が正しい。1.50 mol/L の H2SO4(M = 98.08 g/mol)を g/L にするなら、1.50 mol/L × 98.08 g/mol = 147 g/L となり、mol が約分されて g/L が残る。
熱力学や浸透圧の式に入れる温度は、必ず絶対温度 K にする。°C のまま入れると、0 °C で値が0になるなど意味のない結果になる。
同じ検査でも国によって単位が違う。日本では血糖を mg/dL、ヨーロッパの多くの国では mmol/L で報告する。グルコース(M ≈ 180 g/mol)なら 100 mg/dL ≈ 5.6 mmol/L(100 mg/dL = 1000 mg/L、1000 ÷ 180 ≈ 5.6 mmol/L)。クレアチニンも mg/dL と µmol/L が混在する(1 mg/dL ≈ 88.4 µmol/L)。海外の論文やガイドラインを読むとき、この換算ができないと基準値を読み違える。
English version
Core
Get the main quantities and units straight.
| Quantity | Symbol | Unit |
|---|---|---|
| Amount of substance | n | mol |
| Mass | m | g, kg, mg |
| Volume | V | L (= dm3), mL (= cm3) |
| Density | ρ | g/mL |
| Molar mass | M | g/mol |
| Mass fraction | w (w%) | no unit (0–1), or % |
| Molar concentration | cM | mol/L (= M) |
| Mass concentration | γ | mg/mL, g/L |
| Temperature, absolute temperature | t, T | °C, K (T = t + 273.15) |
Know the prefixes k (103), d (10−1), c (10−2), m (10−3), µ (10−6) and n (10−9).
Going further
For conversions, multiply by a fraction equal to 1. To change 400 mg to g: 400 mg × (1 g / 1000 mg) = 0.400 g. Units cancel like numbers; if the units left are the ones you want, the set-up is right. To change 1.50 mol/L H2SO4 (M = 98.08 g/mol) to g/L: 1.50 mol/L × 98.08 g/mol = 147 g/L. The mol cancels and g/L remains.
In thermodynamics and osmotic pressure equations, always use absolute temperature in K. In °C the result is meaningless — for example, it becomes zero at 0 °C.
In the clinic
The same test uses different units in different countries. Japan reports blood glucose in mg/dL; many European countries use mmol/L. For glucose (M ≈ 180 g/mol), 100 mg/dL ≈ 5.6 mmol/L (100 mg/dL = 1000 mg/L; 1000 ÷ 180 ≈ 5.6 mmol/L). Creatinine also appears in mg/dL and µmol/L (1 mg/dL ≈ 88.4 µmol/L). Without these conversions you will misread reference ranges in foreign papers and guidelines.
グラフと検量線 — 軸の決め方と値の読み取り
実験データのグラフでは、自分で変えた量(独立変数)を x 軸、その結果として測った量(従属変数)を y 軸にとる。時間は x 軸に置くのが慣例である。題は「y 対 x」の形で付け、軸には量の名前と単位を書く。
よいグラフの条件は、①用紙の大部分(目安7割以上)を使う、②目盛りが等間隔で読みやすい(0, 5, 10… や 0.0, 0.1, 0.2…)、③データ点をはっきりした記号で打つ、④点を結ばず、必要なら全体にいちばん合う直線(近似直線)を引く、の4つである。
濃度のわかった標準液を何本か測り、濃度(x)と測定値(y)の関係を直線にしたものを検量線という。表計算ソフトで近似直線を引くと y = ax + b の式と R2(1に近いほど点が直線に乗っている)が出る。未知試料の測定値 y がわかれば、x = (y − b) / a で濃度が求まる。たとえば A = 68.3γ − 0.023 という検量線で A = 0.600 なら、γ = (0.600 + 0.023) / 68.3 ≈ 0.0091 mg/mL となる。
検量線が使えるのは標準液で確かめた範囲の内側(内挿)だけである。範囲の外へ直線を延ばす(外挿)と、実際には直線からはずれている部分を読んでしまう。手描きは点の配置と傾向が直感的に見え、ソフトは式と R2 が正確に出る。両方の長所を知っておくとよい。
病院の自動分析装置も、毎日標準液で検量線を作り直してから患者の検体を測っている。測定値が検量線の範囲を超えると、装置は検体を自動で希釈して測り直し、希釈倍率を掛けて報告する。「測定範囲以上」という表示が出るのは、外挿をしないための安全装置である。
English version
Core
In a graph of experimental data, put the quantity you change (independent variable) on the x-axis and the quantity you measure as a result (dependent variable) on the y-axis. Time usually goes on the x-axis. Title the graph “y versus x”, and label each axis with the quantity and unit.
A good graph ① uses most of the space (at least about 70%), ② has an even, easy scale (0, 5, 10… or 0.0, 0.1, 0.2…), ③ shows data points with clear symbols, and ④ does not join the dots; if needed, draws one best-fit line through all the points.
Going further
Measure several standards of known concentration and draw a line of concentration (x) against signal (y): this is a calibration line. A spreadsheet gives the equation y = ax + b and R2 (the closer to 1, the better the points fit the line). For an unknown sample with signal y, x = (y − b) / a. For example, with the line A = 68.3γ − 0.023 and A = 0.600, γ = (0.600 + 0.023) / 68.3 ≈ 0.0091 mg/mL.
A calibration line is valid only inside the range tested by the standards (interpolation). Extending the line beyond it (extrapolation) reads a region that may not be straight. Drawing by hand shows the pattern of the points clearly; software gives the exact equation and R2. Know the strengths of both.
In the clinic
Hospital analysers also make a new calibration line with standards every day before measuring patient samples. If a result is above the calibrated range, the analyser dilutes the sample automatically and measures again, then multiplies by the dilution factor. The message “above measuring range” is a safety step to avoid extrapolation.
まとめ
| 正確さと精密さ — 系統誤差と偶然誤差 | 正確さ(accuracy)は測定値が真の値(基準値)にどれだけ近いか、精密さ(precision)は同じ条件で繰り返し測った値どうしがどれだけそろっているかである。 |
|---|---|
| 体積をはかる器具 — 精度の順と目盛りの読み方 | 器具は「正確な体積をはかるもの」と「おおよその体積でよいもの」に分かれる。 |
| 有効数字 — 何桁まで信用できるか | 有効数字とは、確かな桁すべてと、最初の不確かな1桁を合わせたものである。 |
| 物理量と単位の換算 — 接頭語・温度・検査値の単位 | 医化学で使う主な量と単位をそろえておく。 |
| グラフと検量線 — 軸の決め方と値の読み取り | 実験データのグラフでは、自分で変えた量(独立変数)を x 軸、その結果として測った量(従属変数)を y 軸にとる。 |
このノートは医学生が授業の内容を自分の言葉でまとめたもので、診療の判断に使うものではありません。誤りに気づいたらお知らせください。